How to Calculate MTBF and MTTR for Your Equipment
FixAhead Team · February 5, 2026
Divide total operating time by the number of failures to get MTBF. Divide the total time from each failure until the asset is back in service, including waiting for parts and people, by the number of failures to get MTTR. MTBF and MTTR show how reliable your equipment is and how efficiently your team responds to failures.
What is MTBF?
MTBF (Mean Time Between Failures) measures the average time between equipment breakdowns. A higher MTBF means more reliable equipment.
How to Calculate MTBF
MTBF = Total Operating Time / Number of FailuresExample: A pump runs for 2,000 hours over 6 months and fails 4 times.
MTBF = 2,000 hours / 4 failures = 500 hoursThis means the pump averages 500 hours of operation between breakdowns.
What MTBF Tells You
- High MTBF — Equipment is reliable; your PM program is working
- Low MTBF — Equipment fails frequently; investigate root causes
- Declining MTBF — Equipment is degrading; consider replacement or increased maintenance
- Improving MTBF — Your maintenance improvements are paying off
What is MTTR?
MTTR (Mean Time To Repair) measures the average time from a failure until the equipment is back in operation, including the time spent waiting for parts, people, approvals, and access. A lower MTTR means faster restoration.
How to Calculate MTTR
MTTR = Total Restoration Time / Number of FailuresExample: That same pump had 4 failures. The restoration times were 2 hours, 4 hours, 1.5 hours, and 2.5 hours.
Total Restoration Time = 2 + 4 + 1.5 + 2.5 = 10 hours
MTTR = 10 hours / 4 failures = 2.5 hours
The average restoration takes 2.5 hours.
What MTTR Tells You
- High MTTR — Repairs take too long; investigate bottlenecks
- Low MTTR — Your team responds and resolves quickly
- Increasing MTTR — Parts availability, skill gaps, or equipment complexity may be issues
- Decreasing MTTR — Procedures, training, or parts stocking improvements are working
Common MTTR Bottlenecks
When MTTR is too high, these are the usual culprits:
- Diagnosis time — Technicians spend hours figuring out what’s wrong
- Parts availability — Waiting for spare parts that aren’t in stock
- Skill mismatch — Wrong technician assigned to the repair
- Documentation gaps — No procedures or manuals available at the point of repair
- Approval delays — Waiting for authorization to proceed with repairs
Using MTBF and MTTR Together
The real power comes from combining these metrics:
Equipment Availability
Availability = MTBF / (MTBF + MTTR) × 100%Using our pump example:
Availability = 500 / (500 + 2.5) × 100% = 99.5%Comparing Assets
When you track MTBF and MTTR across your asset fleet, patterns emerge:
- Low MTBF + High MTTR — Your worst performers; prioritize these for PM or replacement
- High MTBF + Low MTTR — Your best performers; study what’s working
- Low MTBF + Low MTTR — Frequent but quick fixes; may indicate a recurring root cause
- High MTBF + High MTTR — Rare but difficult failures; ensure parts and procedures are ready
How to Track MTBF and MTTR
Manual tracking with spreadsheets works but is error-prone and time-consuming. You need to record:
- Every failure event with timestamp
- Every repair completion with timestamp
- Operating hours between failures
A CMMS automates this. When technicians complete breakdown work orders, the system calculates MTBF and MTTR.
Read MTBF and MTTR in FixAhead
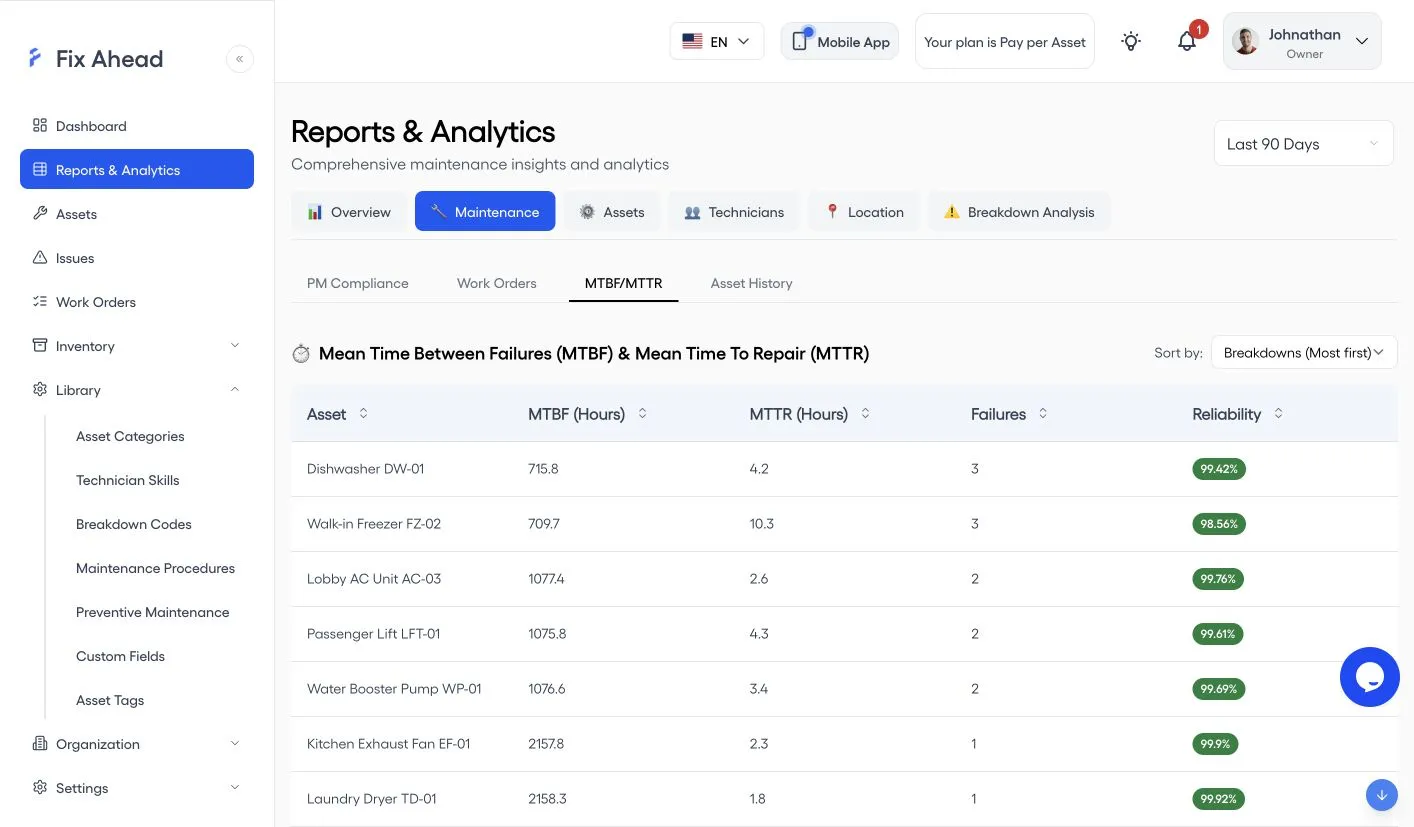
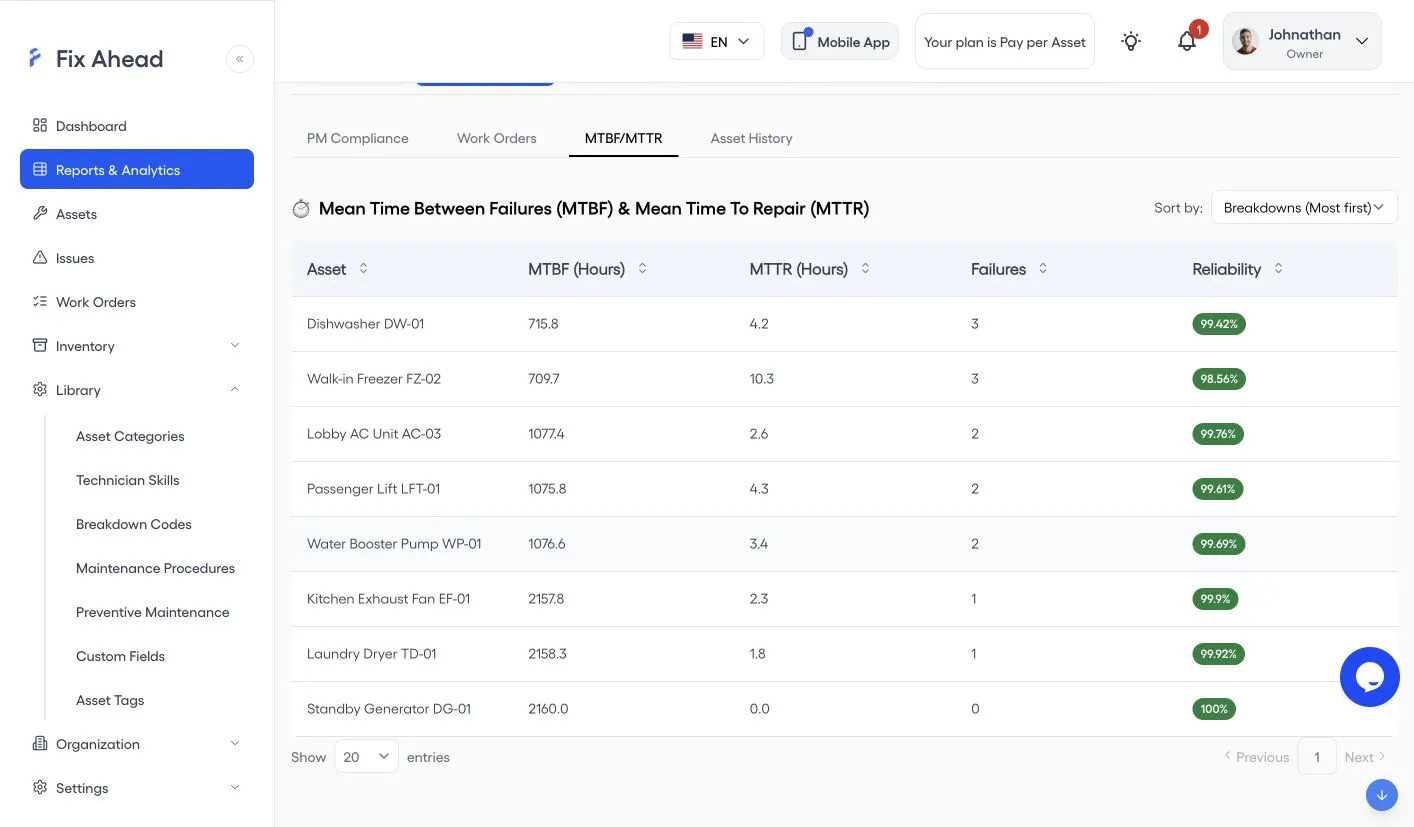
The MTBF/MTTR report lists every asset with its figures for the period you pick.
1. Open MTBF/MTTR under Maintenance
On Reports & Analytics, choose the Maintenance tab, then MTBF/MTTR. The figures cover the period at the top right.
2. Read each asset’s row
Each row counts the breakdown work orders on an asset in the period. MTTR is the average hours from a breakdown work order’s creation to its completion. MTBF is the hours the asset was not under a breakdown work order, divided by its breakdowns; it counts calendar hours, not running hours, so it reads higher than the running-time MTBF above for an asset that does not run around the clock. Reliability is the share of the period the asset was not under a breakdown work order, the availability above. Only work orders marked as a breakdown count. Here the rows run from the most breakdowns down.
Review your baseline over the first year
There’s no universal “good” MTBF or MTTR — targets depend on your equipment, industry, and criticality levels. Start by baselining your current numbers, then review them on this schedule:
- First 90 days — Establish baselines for your critical assets
- 6 months — Compare MTBF with the baseline, to see what PM has changed
- 12 months — Compare MTTR with the baseline, to see what procedures and parts stocking have changed
Calculate MTBF and MTTR for your own assets
Take the scheduled hours, unplanned downtime, and failures for one asset, and run them through the MTBF calculator. For MTTR, take its failures and the hours each took to get back in service, and run them through the MTTR calculator. Then repeat both for each critical asset, and track the results as they change.