Maintenance metrics and KPIs
The maintenance metrics worth tracking, how each is calculated and what the record must hold, which published benchmarks exist, and how to choose the few your team can act on.
Track a metric only when someone on the team can change it and everyone calculates it the same way. Choose the few your team can act on, and calculate each one from your own records.
Choose the Few Metrics Your Team Can Act On
Have the owners of each process take part in choosing the metrics, after the team sets the goals they measure. US federal guidance (NASA, 2008), section 12.5 says the goals should be attainable, and that owners weigh the cost of obtaining the data against the value a KPI adds.
The SMRP 2018 metrics workshop deck gives rules for using metrics: a metric should be understood by the people who use it and be within their influence. Use several metrics together, tie them to the business objectives, and check the definitions so that sites compare like with like.
Keep the Data Behind Each Figure Accurate
Keep the data accurate before you read any figure from it. The SMRP 2018 metrics workshop deck says that bad data is worse than no data. The Records needed column in the table below is what makes a figure checkable.
Use Several Measures, So a Gain in One Shows Against the Rest
Use several measures together, so that a gain in one shows against the others. The SMRP 2018 metrics workshop deck warns that the areas measured will change, and that one area can be pushed to optimize its own number at the cost of the whole.
Calculate Each Figure from the Record It Needs
Calculate each figure with the formula in its row. The last column lists the records your system needs to calculate it.
| Figure | Calculation | Records needed |
|---|---|---|
| Availability, per US federal guidance (FEMP, 2010), section 3.1.1 | Hours each unit is available to run at capacity ÷ total hours in the period | Start and end of each outage, and the period’s total hours |
| MTBF, per US federal handbook (NIST e-Handbook of Statistical Methods), section 8.4.5.1 | Total operating time ÷ number of failures. Its reciprocal is the failure rate | Each failure, with the operating hours since the previous one, from CMMS history |
| MTTR, per IEC 60050-192, entry 192-07-23 | Total time to restoration ÷ number of failures restored | For each failure: the failure or detection time, and the time the asset returned to service |
| PM completion, per US federal guidance (FEMP, 2010), section 3.1.1 | PM actions completed ÷ PM actions scheduled | Due date and completion date for each PM, and the on-time tolerance set in writing |
| Schedule compliance, per US federal guidance (NASA, 2008), section 12.10.3 | Labor hours worked on scheduled jobs ÷ labor hours scheduled | Scheduled and actual hours for each job |
| Overdue PM work orders, per US federal guidance (NASA, 2008), section 12.4 | Count at month end, trended over time | Due date and status of each open PM |
| Emergency work, per US federal guidance (FEMP, 2010), section 3.1.1 | Hours on emergency jobs ÷ total hours worked | Job type on each work order |
| Maintenance cost per asset | Labor hours at the labor rate, plus parts and contracted work charged to the asset | Hours, rate, and parts used on each work order |
Start MTTR at the Failure, Not at the Work Order
Start each failure’s time at the failure, or at its detection when the moment of failure cannot be known, and stop it when the asset is back in service. IEC 60050-192, entry 192-07-06 defines time to restoration this way. This guide uses mean time to restoration, as IEC 60050-192, entry 192-07-23 defines it; the standard marks “mean time to repair” as deprecated. It includes waiting for people, parts, approvals, and access, as well as the hands-on work. Hands-on time alone is a different measure: IEC 60050-192, entry 192-07-19 calls it repair time. Do not enter labor hours as restoration hours.
Read MTBF Asset by Asset
Read MTBF asset by asset, from the asset’s own history in the CMMS. US federal guidance (NASA, 2008), section 5.5.5.1 says MTBF should be calculated from machinery history stored in the CMMS, with operator logs, parts usage, and contractor records as other sources. For work orders as a whole, use schedule compliance. In FixAhead, the MTBF/MTTR report shows both figures for each asset, and the MTBF and MTTR post walks through reading it.
Measure Planning with Schedule Compliance
Measure the planner’s work with schedule compliance: labor hours worked on scheduled jobs, against labor hours scheduled. US federal guidance (NASA, 2008), section 12.10.3 sets its target at 90 percent or better. Wrench time is the other planning figure, and a 2022 Plant Services article argues that it can be a terrible metric and is probably best left unmeasured.
Use Published Benchmarks for Direction, Not as Targets
Use the published benchmarks as a reference for direction, not as a target for your team. US federal guidance (FEMP, 2010), section 3.1.1 lists industry benchmarks, and does not say which organizations they describe: availability above 95 percent; schedule compliance above 90 percent; emergency work below 10 percent of hours; overtime below 5 percent of regular maintenance hours; PM completion above 90 percent; and PM cost at 15 to 18 percent of total maintenance cost.
US federal guidance (NASA, 2008), section 12.10 sets targets for facilities maintenance. Schedule compliance should be 90 percent or better. The ready-to-work backlog should be 3 to 5 crew weeks, and the total open backlog 4 to 6 crew weeks. Crew weeks are estimated labor hours divided by the hours available to schedule each week. Estimated labor on completed work orders should fall within 15 percent of actual labor.
Agree Each Definition in Writing Before You Compare
Agree each definition in writing before you compare sites or months. Two sites can report different figures for the same month because they count different things.
- Reactive work. The reactive work metric in the SMRP 2018 metrics workshop deck, metric 5.4.1 counts work that interrupts the weekly schedule, as a share of maintenance labor hours. US federal guidance (FEMP, 2010), section 3.1.1 counts hours on emergency jobs. The two can differ for the same month.
- PM completion. US federal guidance (FEMP, 2010), section 3.1.1 counts completed PM actions against scheduled ones and sets no tolerance for how late a PM may be. Set the on-time tolerance in writing before you compare sites or months.
- Wrench time. A 2019 Plant Services article puts wrench time at about 35 percent at most plants, even good ones, and at about 55 percent after proper planning and scheduling.
Count planned and reactive work the same way each month, and track the planned share over time, as Preventive vs Reactive Maintenance: The True Cost Difference sets out.
Start with One Project a Small Team Can Finish
Start with one project that can finish in six months to a year, on equipment with a visible history of trouble. US federal guidance (FEMP, 2010), section 3.6 advises this, and notes that accurate records are critical to compare before and after results.
Questions to Ask a Vendor
Ask each vendor these questions before you sign.
- How does the system calculate each figure, and can I see the formula?
- Does MTTR run from the failure or its detection, or only from the work order?
- Can PM compliance be measured against an on-time tolerance I set for each schedule?
- Can I export the raw records behind every report?
Uptime and Downtime per Asset
Check each asset’s uptime and downtime in FixAhead’s asset utilization report, which sorts the assets by downtime over a date range.
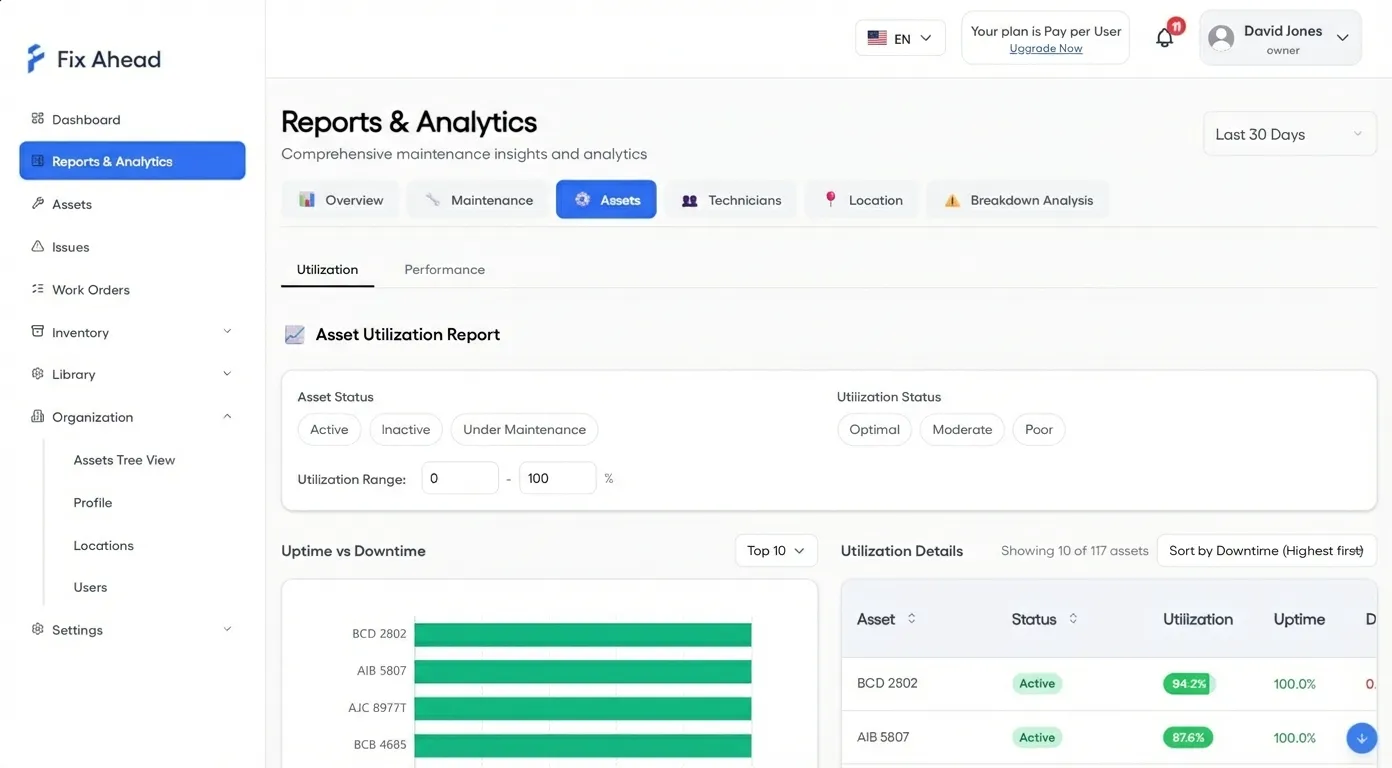
FixAhead has eleven built-in reports, among them MTBF, MTTR, and PM compliance. Each exports to PDF, Excel, or CSV (reporting). All eleven are part of the Pro plan (pricing).
Calculate the figures with the MTBF calculator and the MTTR calculator. For MTBF worked through on a pump, read How to Calculate MTBF and MTTR for Your Equipment.
Read Maintenance Cost in FixAhead
1. Open Overview on Reports & Analytics
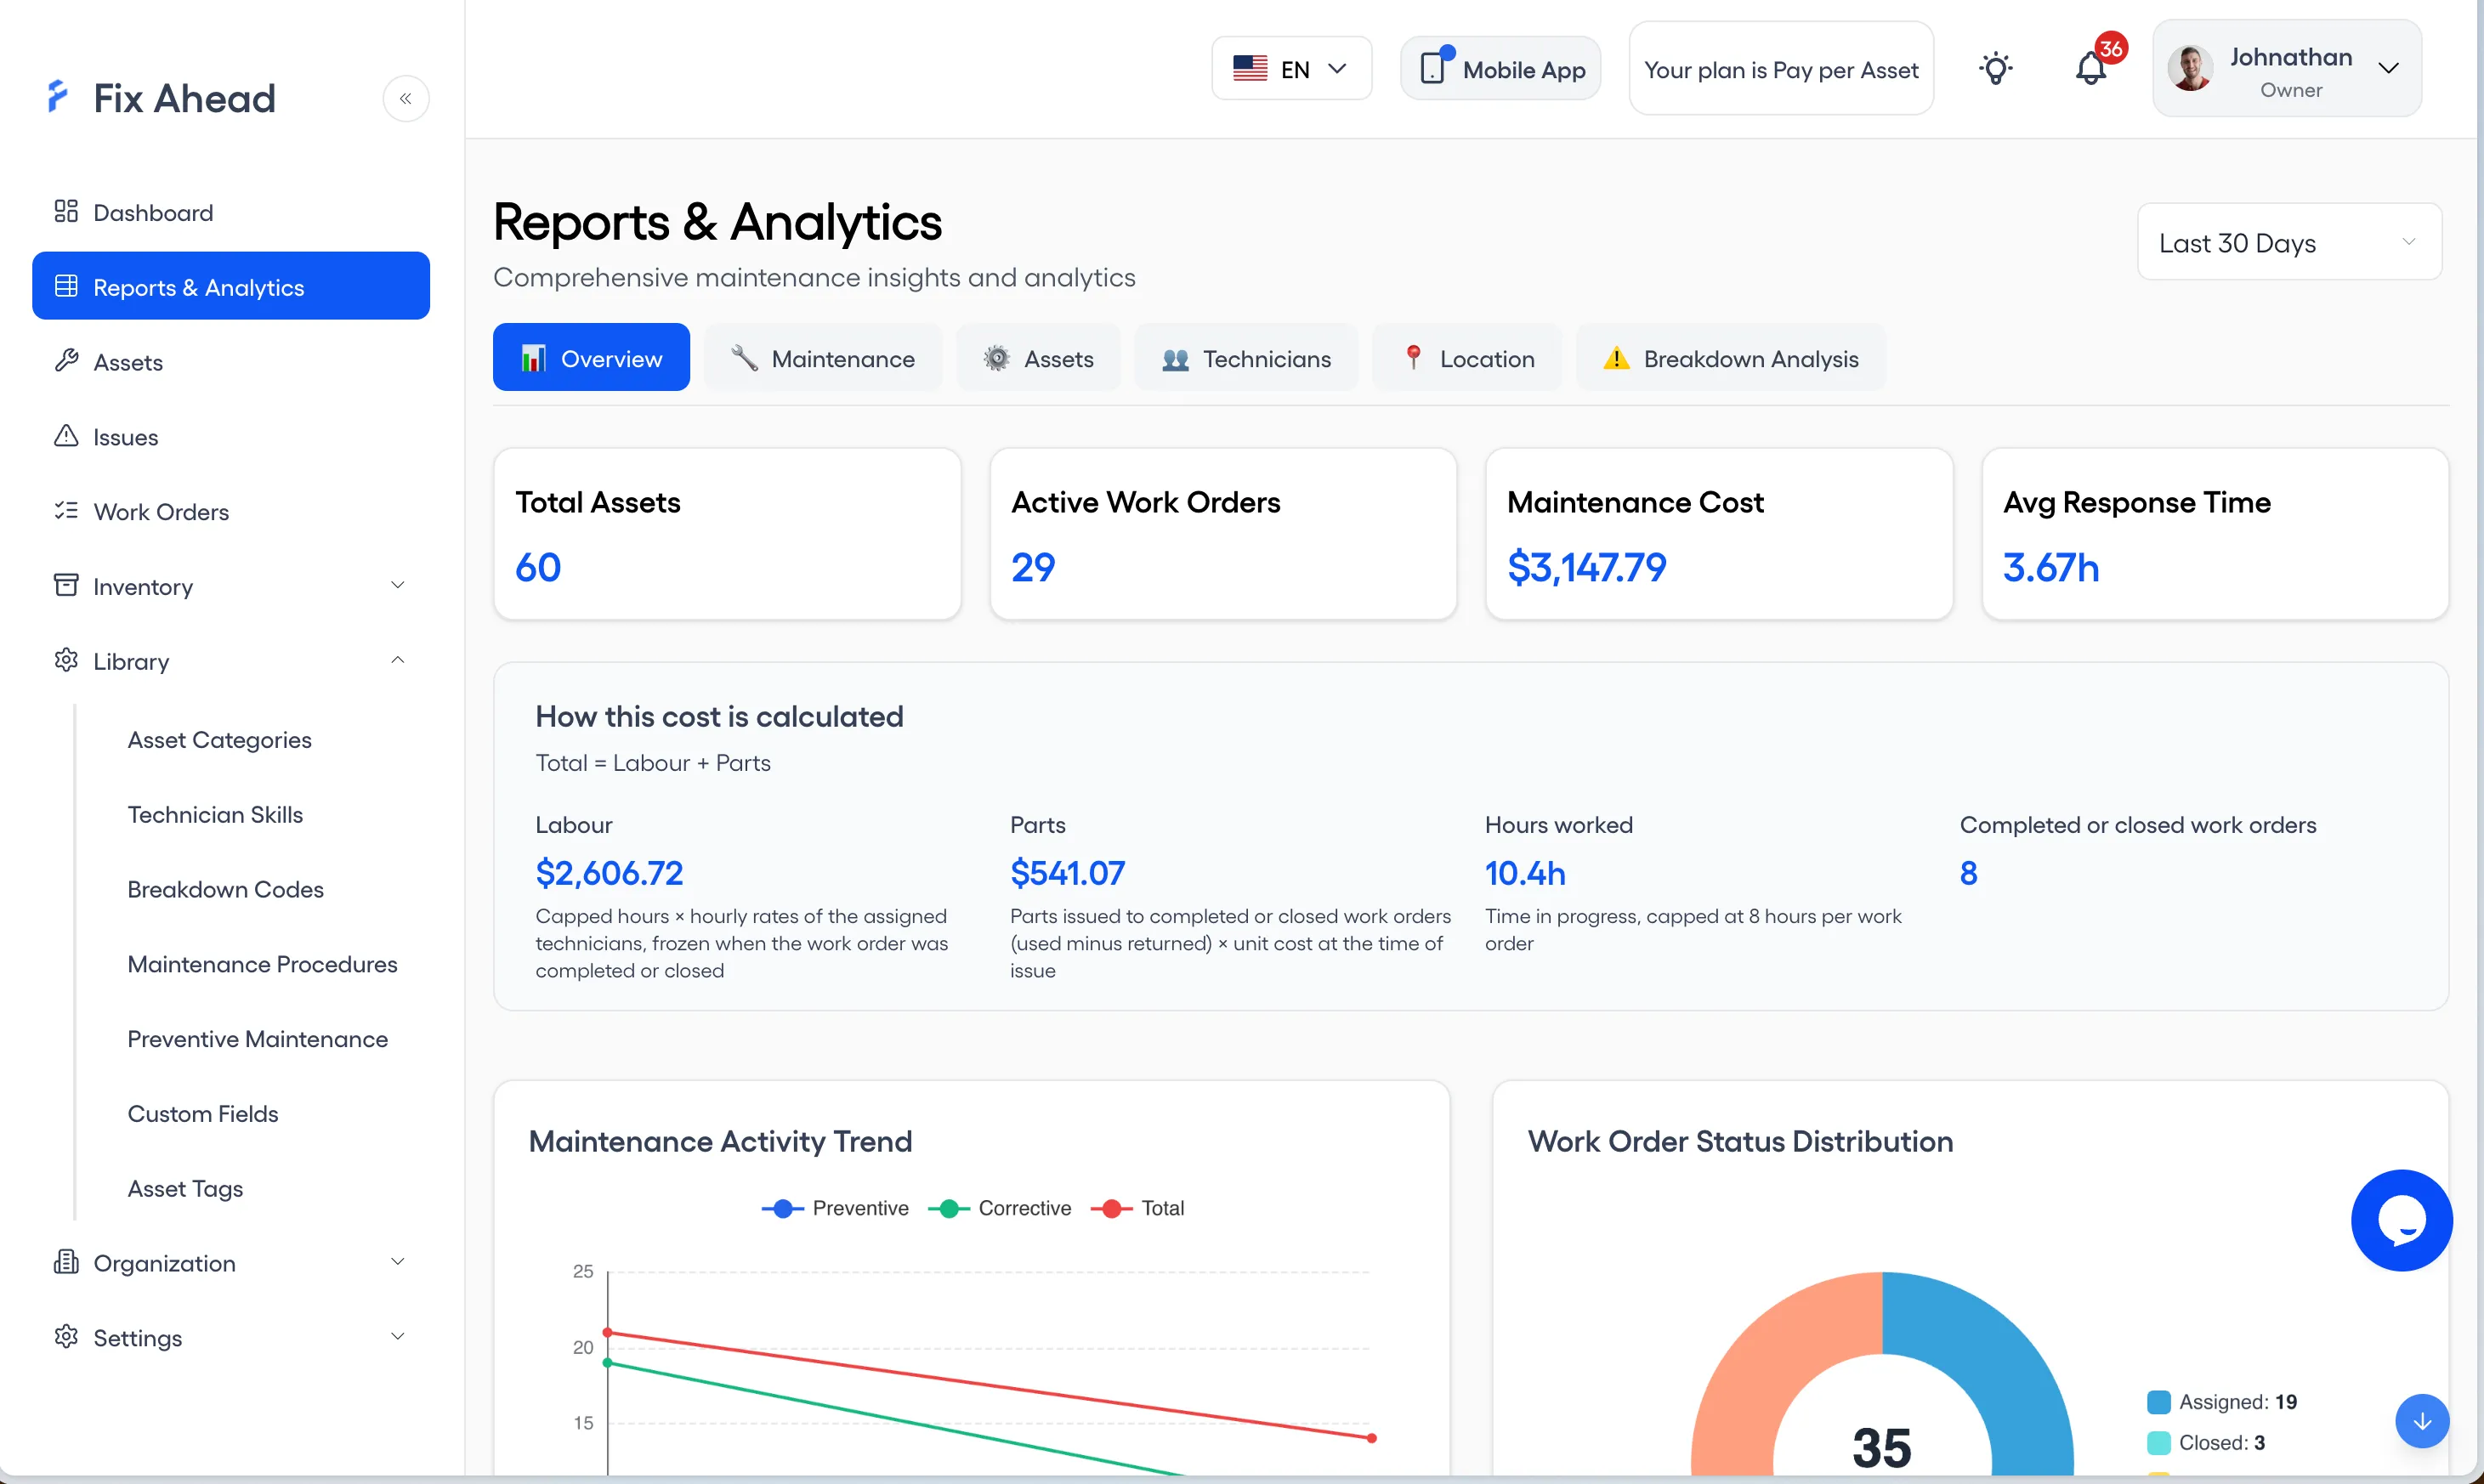
Overview shows Maintenance Cost beside Total Assets, Active Work Orders and Avg Response Time. Below the cards, How this cost is calculated splits the cost into Labour and Parts, with the hours worked and the completed or closed work orders behind it.
Set Up PM Completion First
Set up PM completion first. Write the on-time tolerance down, and record the due date and completion date of each PM, as the table above lists. Add the other figures once PM completion calculates from your records.
Read PM Compliance in FixAhead
The PM Compliance report rates each asset’s preventive maintenance.
1. Open PM Compliance under Maintenance
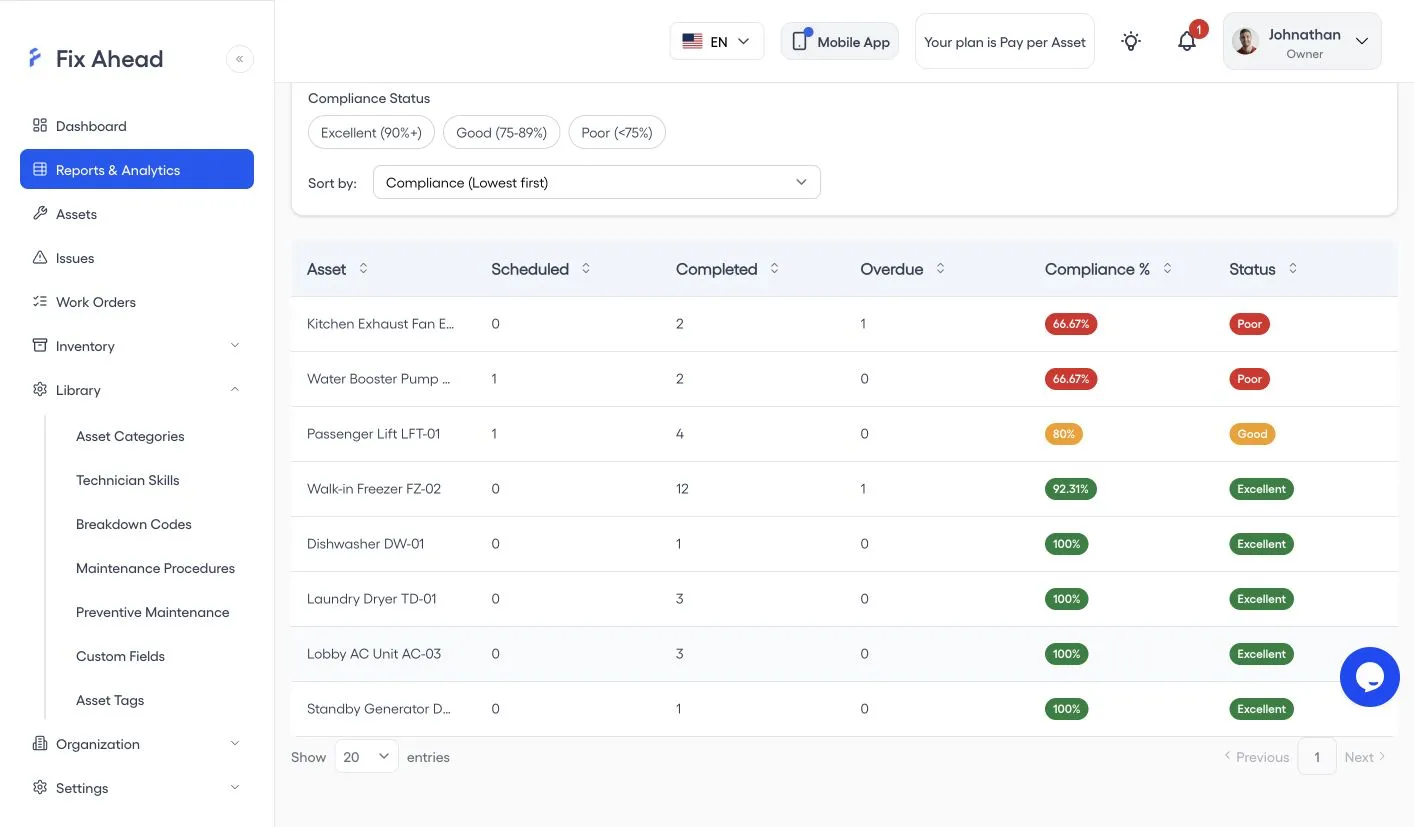
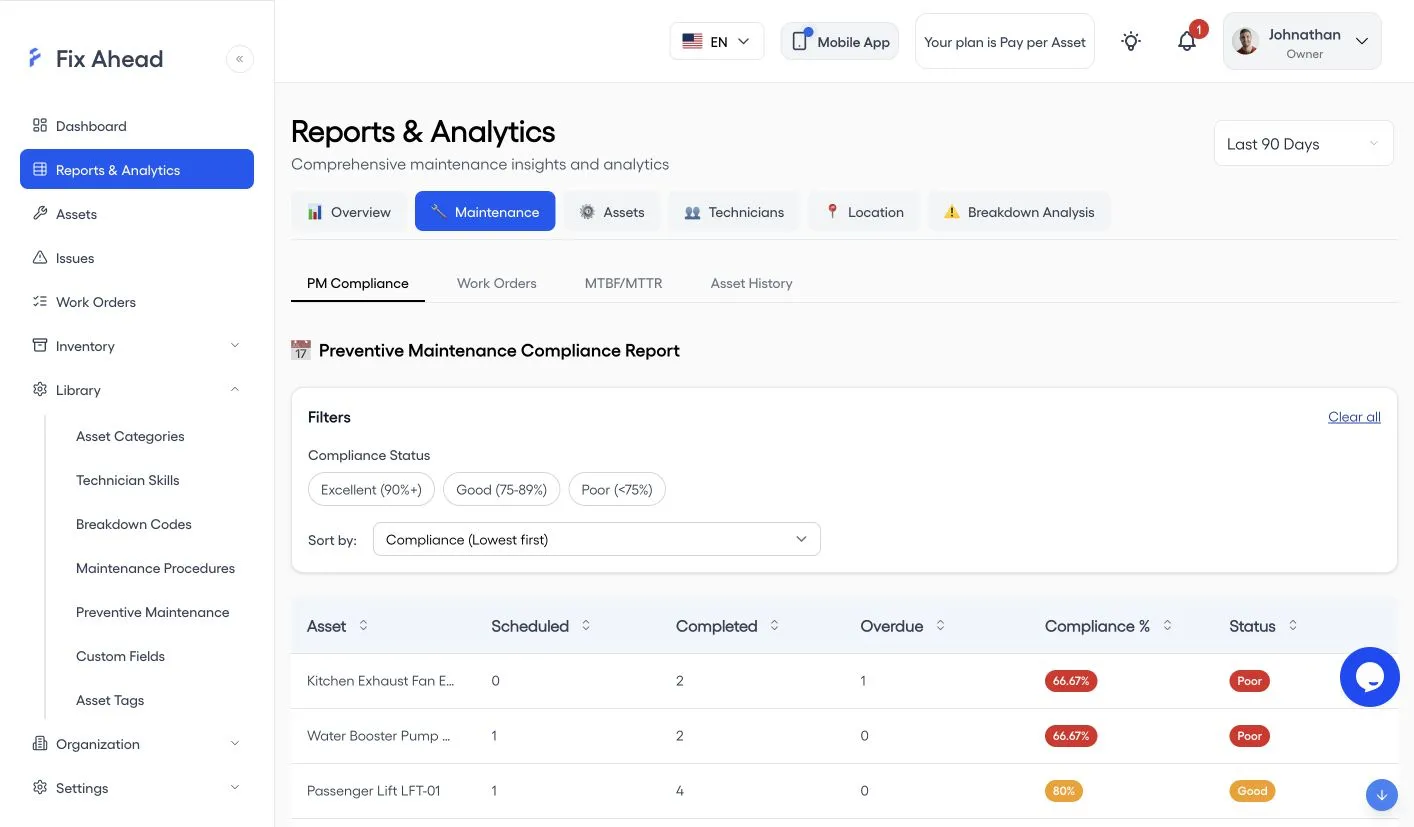
On Reports & Analytics, choose the Maintenance tab, then PM Compliance. Compliance Status lists the ratings Excellent (90%+), Good (75-89%) and Poor (<75%).
2. Read each asset’s compliance
Each row gives an asset’s Scheduled and Completed PM work, its Overdue count, and its Compliance % with a Status. Here the rows run from the lowest compliance up.